Turning Systems Into Scale
This is where I prototype internal tools, governance workflows, and analytics that tie support, sales, and operations together. Not production apps—model-style prototypes that solve real problems, clarify ideas, and show how better systems create better outcomes.
Each project below started as a question: What if we could see this sooner, automate that step, or enforce this rule automatically? Then I built just enough to test the answer.
📊 End-to-End E-Commerce Case Study (Complete)
Olist Analytics Warehouse
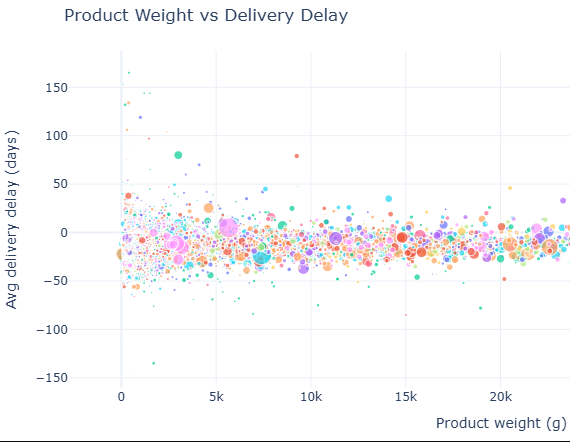
A fully built, production-style analytics project that turns the Olist e-commerce dataset into a star-schema warehouse and a 10-notebook analytics suite. Built in Databricks with Python, SQL, DuckDB, and interactive Plotly charts, it covers the entire lifecycle from raw Kaggle ingest to portfolio-grade storytelling.
- Ingested raw Olist data directly from Kaggle via API keys, staged it in notebooks, and modeled a fact + dim star schema for customers, orders, payments, logistics, products, sellers, and geo.
- Designed a reusable ETL pattern with documented CTEs, notebook-level TOCs, and clearly separated bronze → silver → gold style transformations for analytics-ready tables.
- Built 10 domain notebooks (customers, logistics, payments, reviews, product mix, sellers, geo, time-series, operations, portfolio) each with narrative, SQL, and embedded Plotly visuals (AOV, repeat rate, funnels, shipping delays, NPS vs delivery, seller reliability, and more).
- Wrapped everything in a portfolio-friendly layout so teams and clients can quickly scan the page and see how I reason about growth, retention, and operational health starting from raw data.

🛡️ Guardrail — Process Governance System (Prototype)
A compliance firewall concept for AI workflows. Guardrail proxies model calls, inspects responses against written policies, and decides whether to allow, redact, block, or escalate before content reaches end users.
- Policies defined in YAML so behavior is versioned, reviewable, and auditable.
- Every decision logged with reason codes and metadata for governance reports.
- Designed as an adapter that could sit in front of any LLM or agent stack.

⚙️ CRM Dupe Remover — Data Hygiene Script (Prototype)
A Python prototype that uses fuzzy matching and domain logic to detect and merge duplicate CRM records—cleaning up contact lists before they hit campaigns, dashboards, or sales workflows.
- Experimented with similarity scoring, email/domain matching, and merge rules.
- Cleaned thousands of mock entries in sandbox tests as a proof of concept.
- Became the reference model for what large-scale deduplication could look like in Zoho CRM.
📊 Service Desk KPI Dashboard — Live Metrics Hub (Prototype)
A Power BI dashboard that turns ticket data into a control panel for support operations—tracking SLA performance, resolution time, and volume patterns so leaders can see issues before they spike.
- Modeled SLA, backlog, and volume trends from exported ticket data.
- Shifted the team from “gut feel” to objective metrics for speed and quality.
- Laid the groundwork for a future real-time data pipeline into support ops.

🧠 SQL Insights — Trend Detection Sandbox (Prototype)
A SQL playground where I built queries and mock datasets to explore how support tickets cluster: by product, region, and root cause—and how those patterns can drive better investigations.
- Wrote queries to surface emerging issue clusters and repeat offenders.
- Used the sandbox as a learning lab for analytics storytelling and governance.
- Serves as a template for future reporting layers on top of production data.